Power BI
Introduction

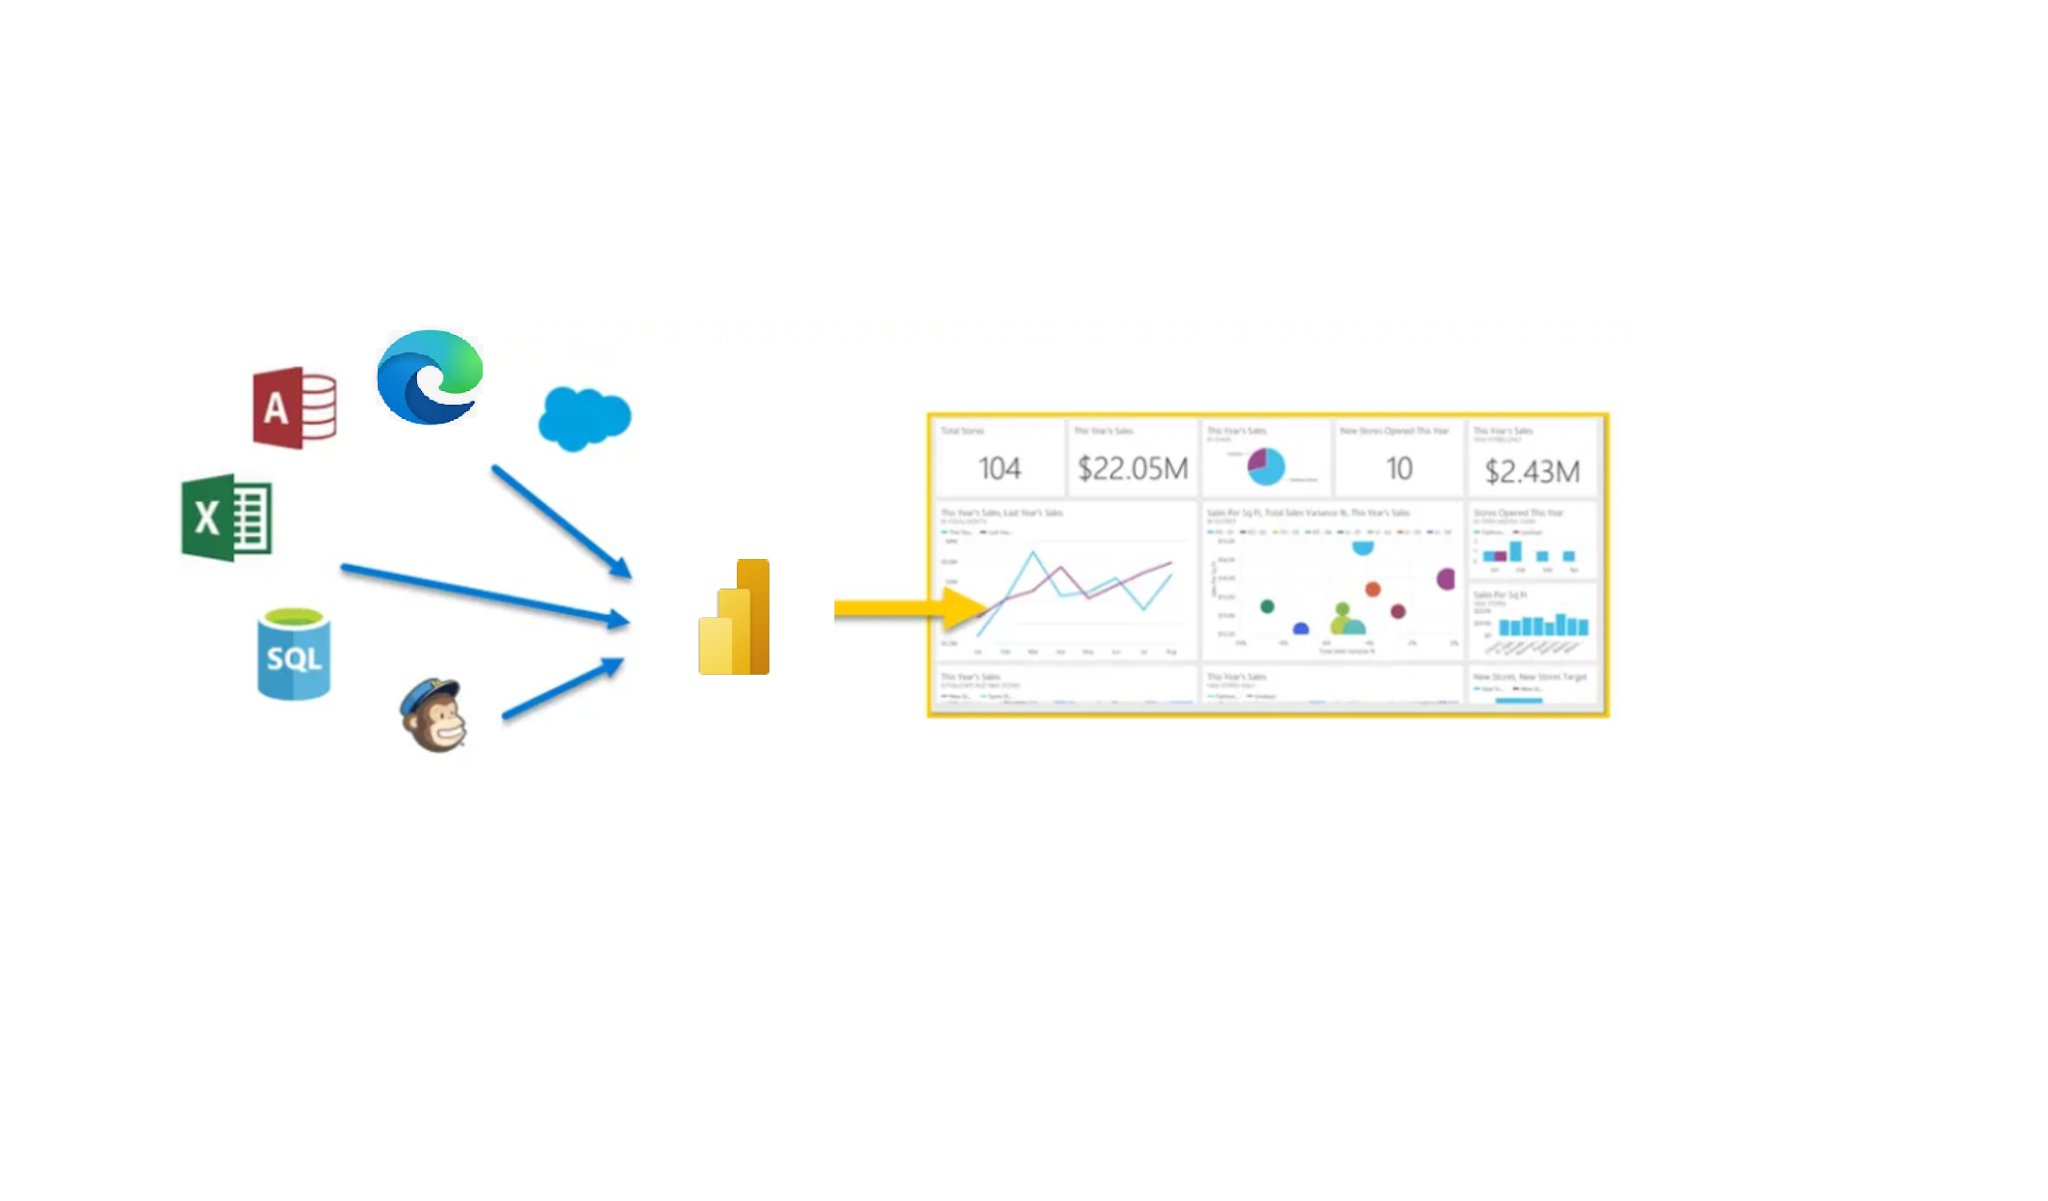
Power BI is a service provided by Microsoft for business analytics that helps to visualize data and share it across people of and on different platforms. It converts or builds reports on data, taken from different data sources to build an interactive Dashboard.
As Power Bi is robust and enterprise-graded, It is not only used for modeling and real-time analytics but also for custom development. It is fast and simple with the capability of taking data from an excel sheet or a local database or from any other data source.
You can use three different elements of Power BI. That is Power BI Desktop, Power BI service (on the web), and Power BI Mobile.
Building Blocks of Power BI
Power BI consists of five building blocks which are: Visualization, Dashboards, Reports, Apps, and Datasets. This is also known as Power BI content which exists in the workspace. A normal flow consists of all the building blocks. Let see in detail about these blocks:


5. App:- A designer can bind and share the related dashboard and report together through an app.


Comments
Post a Comment